The Monitoring section in the Hydra dashboard provides several graphs for monitoring system and database metrics. You can access the Monitoring dashboard from the sidebar in the Hydra dashboard. Observable metrics include:Documentation Index
Fetch the complete documentation index at: https://docs.hydra.so/llms.txt
Use this file to discover all available pages before exploring further.
- Active Connections
- Local file cache hit rate
- Queries per second
- Storage Used (GB)
Specifications: plan size, region, version, RAM, on-disk storage
Select your project from the project tab. You’ll automatically enter the “Dashboard” tab. High level specifications of your Hydra instance will be show on the top right of the page. These specs include plan size, region, Postgres version, RAM (memory), and on-disk storage used..png?fit=max&auto=format&n=yL_jvOZ3zOfO9lO9&q=85&s=a0fe2d21a3f9d71a67f81b5ba4d1f74b)
Monitoring Interval
Once a project has been selected, navigate to the Monitoring tab. At the top, you can change your desired time interval by which to view the Database metrics. The options, as shown above, are 5 min interval, 15 min, 1 hour, 6 hours, 1 day, 2 days.
Monitoring Metrics
In Hydra’s monitoring tab, we provide several key metrics for tracking the health and performance of every Hydra instance: Active connections, Cache Hit Rate, Queries Per Second, and Storage Used (GB). If you would like additional metrics added to your Hydra dashboard, please open a support ticket to make the request.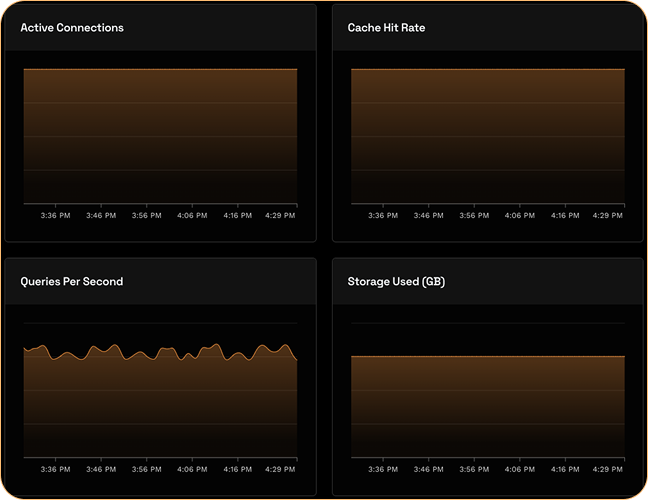
Active Connections
Active connections indicate the number of open connections to the database, and excessive connections can lead to resource strain and performance issues. Track this metric to optimize resource allocation and anticipate scalability needs. It’s good practice to check the active versus idle connections by runningSELECT * FROM pg_stat_activity . If there are many idle connections, it’s recommended to investigate a connection pooling solution, such as PgBouncer, which can reduce connection overhead and maintaining a manageable connection count.
Cache Hit Rate
The cache hit rate defines the ratio between the number of reads from the PostgreSQL buffer cache (shared_buffers) to the total number of reads from disk and cache combined. Monitoring the ratio is crucial to analyzing the data reads and maintaining the proper ratio. Ideally, the cache hit rate should be above 99%, meaning at least 99% of database reads should be from cache and at most 1% from the disk.
Queries per Second (QPS)
Queries Per Second (QPS) is a metric for assessing the current query load of a database. It measures the number of queries that the database is executing in a single second, providing insight into the system’s ability to manage concurrent workloads and throughput demands. By monitoring QPS, users can identify patterns, detect anomalies, and anticipate potential bottlenecks.Storage Used (GB)
A surge in the storage of data or excessive access to disk storage can cause higher disk latency, server’s I/O throughput and delayed query processing. DBAs can monitor the disk’s read/write latency and read/write throughput of IO processes to baseline an ideal disk consumption and identify bottlenecks. An ideal disk usage should remain below 85%, while attributing 90% of baselined disk usage to a critical alert. Ideally, the bulk of Hydra user’s storage footprint should reside in compressed Hydra Lake Storage, not Postgres’ on-disk storage. If you would like our assistance with offloading your growing dataset to object storage, please contact our support team.Additional Tools
Tune Queries with EXPLAIN
It’s recommended to utilize theEXPLAIN parameter with queries to display the query execution plan that is being used to run the query statement. Additionally adding ANALYZE along with the EXPLAIN parameter helps identify slower queries as it provides finer, more accurate details such as the total time spent on the query execution, the time required to finish a sort program, etc. It is also a suggested practice to maintain an appropriate index for each table and keep reviewing them periodically.
pg_stat_statements
pg_stat_statements uses query identifier calculations to track the planning and execution statistics of all SQL statements the database server has executed. The module records the queries run against the database, extracts variables from the queries and saves the query’s performance and execution data. Instead of storing individual query data, the pg_stat_statements module parametrizes all queries run against the server and stores the aggregated result for future analysis. pg_stat_statements is pre-installed on all Hydra databases.PgHero
PgHero is an open-source performance tool for Postgres that can help you find and fix data issues, using a dashboard interface. A quick look at the interface gives you an idea of what you’ll find in PgHero.
- Identify long-running queries
- Identify tables that require vacuuming
- Identify duplicate or missing indexes
- View connections by database and user
- Explain, analyze, and visualize queries
How to install PgHero
PgHero supports installation with Docker, Linux, and Rails. Here, we’ll show how to install PgHero with Docker and connect it to a Hydra database. Before you begin:-
Ensure that you have the
pg_stat_statementsextension installed and enabled. PgHero uses it for query stats. - Ensure that you have Docker installed. See Install Docker Engine for instructions.
How to connect to your database from PgHero
Find your Hydra Postgres connection string from the Dashboard tab of the Hydra dashboard.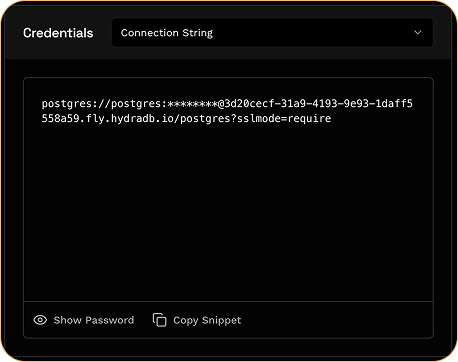
$HYDRA_DB with your Hydra database connection string.
pgAdmin
pgAdmin is a database management tool for Postgres designed to facilitate various database tasks, including monitoring performance metrics. With pgAdmin, you can monitor real-time activity for a variety of metrics including:- Active sessions (Total, Active, and Idle)
- Transactions per second (Transactions, Commits, Rollbacks)
- Tuples in (Inserts, Updates, Deletes)
- Tuples out (Fetched, Returned)
- Block I/O for shared buffers
- Database activity (Sessions, Locks, Prepared Transactions)

How to install pgAdmin
Pre-compiled and configured installation packages for pgAdmin 4 are available for different desktop environments. For installation instructions, refer to the pgAdmin deployment documentation. Downloads can be found on the PgAdmin Downloads page.How to connect to your database from pgAdmin
Find your Hydra Postgres connection string from the Dashboard tab of the Hydra dashboard.5432.